In a nutshell, we can say that User Behavior Analytics wants to answer one single question: What’s being done by our customers?. This line of tech work is popular both in product development teams and among marketers. The reason is it transforms data into actionable information that empowers decision-making. To do so, it uses user behavior data – in other words, the data generated by, or in response to, a user’s engagement with a business or a system.
What does User Behavior Analytics mean?
User behavior analytics examines the “what’s” and “how’s” of the user behavior data to inform the “why’s” of the customer behavior. This can include tracking page views for the web, email sign-ups, or other important actions like a registration flow. This type of data is normally captured in the form of events.
Events in User Analytics
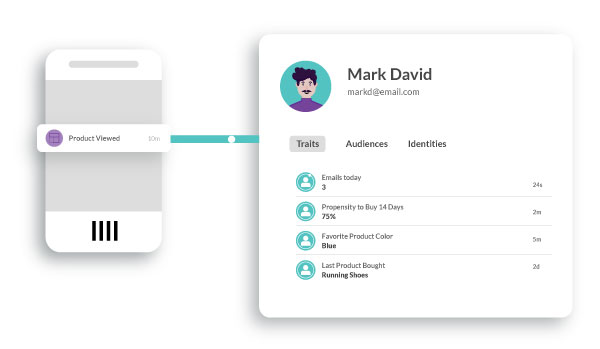
So what are events in User Behavior Analytics? Well, you can think of events as the “what”. An event features properties, these we should consider as the “when, who, where, and how”. An example of events for e-commerce could be:
- Product Viewed
- Product Added to Cart
- Cart Viewed
- Order Completed
In turn, each one of those could feature multiple product identification properties, also user identification, or transaction identification.
How do we use Events in our favor?
An Event is the raw stage of our data, and if used correctly it enables us to do all sorts of things with it, from a simple Behavior Funnel analysis to understand user retention, to creating prediction algorithms with Machine learning to understand the user’s probability of buying a product, it’s all up to you, and your strategy. Once you know how to handle your events, you’ll have your answer the “why”.
But how exactly do tracking and analysis help my business?
To quote a very smart executive:
“It really doesn’t matter if you are a 60-year-old woman or a 20-year-old man because a 20-year-old man can watch Say Yes To The Dress and a 60-year-old woman could watch Hellboy.” – Todd Yellin, VP of Product Innovation at Netflix
By using data instead of “hunches”, decisions gain credibility and effectiveness – be it at an operational, tactical, or strategic level. Applying User Behavior Analytics means you stop guessing, plus avoid making wrong assumptions! 4 things to keep in mind:
- You can’t only use qualitative or demographic data to assign a user to a “persona”.
- Their needs, interests, wants or values are totally individual.
- Instead of making assumptions about them, you should focus on what they are doing.
- The user’s behavior can show you a much more accurate view of what they want and need, and it’s up to you to use the data to understand how and when to best deliver it to them.
What can my company achieve through User Behavior Analytics?
There are two major fronts in which User Behavior Analytics can support you: Customer Acquisition and Customer Retention and Growth.
In terms of Customer Acquisition, you can leverage data to make decisions that will:
- Improve the rate of customer acquisition
- Increase conversion rates
- Increase the velocity to purchase
- Increase purchase sizes
- Improve marketing ROI
For Customer Retention and Growth efforts, User Behavior Analytics helps companies:
- Improve retention/lower churn
- Increase repeat purchases
- Decrease cost of service
- Improve customer satisfaction and loyalty
- Increase lifetime value
How to Build a Business Strategy using User Behavior Analytics
There are 4 steps you should carry out. They are, basically speaking, a matter of answering questions that help you organize your thoughts.
- Answer the most important question of all: What, and why do we want to understand from our users? Try to look into your business, and see where do you have a lack of your user’s data.
- Establish goals! Which metrics and KPIs are critical? What do we want to achieve in the short/medium/longer term?
- Build a solid tracking plan. Once you know what you want to measure, it’s time to plan on how to do it.
- Keep track of your work and tools. You can have quick wins during the process of implementing user behavior data, it all depends on the tools and the ways that you want to work with them. Google Analytics, for instance, has quite a few useful reports that are already predefined.
Key tools to capture User Data and analyze it
Batman is nothing without his belt. The same goes for data scientists and analysts, or marketers. Some tools I like to work with are:
| Behavior Analytics Tool | Uses and Applications |
|---|---|
| In their own words: Adobe Analytics allows you to mix, match, and analyze data from anywhere in the customer journey. It combines data from web traffic, your Marketing Automation tools, and your Customer Relationship Management (CRM) software. | |
 |
Google Analytics lets you measure your advertising ROI as well as track your Flash, video, and social networking sites and applications. |
| Crazy Egg gives you the competitive advantage to improve your website. After running a heatmap test on this variant, it becomes clear where users are clicking on: for example, a text link or client logos instead of Call-to-actions (CTAs), generating valuable insights and feedbacks for UI/UX. | |
| Hotjar complements the data and insights from web analytics tools like Google Analytics. It empowers Behavior Analytics and User Feedback through tools such as heatmaps, session recordings, and surveys. | |
| Amplitude is a product analytics platform that also tracks users, but this time using collaborative analytics. The platform uses behavioral reports to understand users’ interactions with products and provides insights on a real-time basis. | |
 |
Web and mobile applications use Mixpannel to track user interactions, allowing more targeted communication with them. This product analytics platform’s toolset contains in-app A/B tests and user survey forms, as well as reports. |
Now you know which tools you can choose to build your arsenal, it’s time to take your User Behavior Analytics to the next level!
How to set up a CDP – Customer Data Platform
A CDP is a piece of software that combines data from multiple tools to create a database of your customers, and how they behave in the multiple platforms you may have. The CDP is totally customer-oriented and has the main goal of Identifying and Segmenting your customers. So what kind of results can it bring?
Let’s turn to some industry benchmarks:
- Netflix has 75% of viewer activity is driven by recommendations. (Springtab)
- Amazon generates 35% of sales are through their recommendation engine. (Martech Advisor)
- IBM Cloud increased revenue by 70% by using reliable customer data with a CDP to uncover expansion opportunities. (Segment)
- DigitalOcean saw a 33% improvement in cost per conversion when using a CDP by using smart audience targeting. (Segment)
I hope these results will excite your company as much as it does mine. If you haven’t dived into User Behavior Analytics, you sure should!
Would rather chat with us directly? Drop us a line.

International Marketing Leader, specialized in tech. Proud to have built marketing and business generation structures for some of the fastest-growing SaaS companies on both sides of the Atlantic (UK, DACH, Iberia, LatAm, and NorthAm). Big fan of motherhood, world music, marketing, and backpacking. A little bit nerdy too!

UbiNews
Subscribe now to receive our exclusive publications directly in your inbox.

